Aspiring data scientist? Master these fundamentals.

Photo by Dmitri Popov on Unsplash
Data science is an exciting, fast-moving field to become involved in. There’s no shortage of demand for talented, analytically-minded individuals. Companies of all sizes are hiring data scientists, and the role provides real value across a wide range of industries and applications.
Often, people’s first encounters with the field come through reading sci-fi headlines generated by major research organizations. Recent progress has raised the prospect of machine learning transforming the world as we know it within a generation.
想成为有抱负的数据科学家?掌握这些基本原理。
取自Unplash,由Dmitri Popov拍摄数据科学是一个令人兴奋,快速发展的领域。对于才华横溢,具有分析意识的人来说,并不缺乏需求。 各种规模的公司都在招聘数据科学家,这个角色为各种行业和应用提供了真正的价值。
通常,人们第一次接触这个领域是通过阅读主要研究机构产生的科幻标题。近年来的进步已经提升了机器学习的前景,正如我们在一代人中所知道的那样。
However, outside of academia and research, data science is about much more besides headline topics such as deep learning and NLP.
Much of the commercial value of a data scientist comes from providing the clarity and insights that vast quantities of data can bring. The role can encompass everything from data engineering, to data analysis and reporting — with maybe some machine learning thrown in for good measure.
This is especially the case at a startup firm. Early and mid-stage companies’ data needs are typically far removed from the realm of neural networks and computer vision. (Unless, of course, these are core features of their product/service).
Rather, they need accurate analysis, reliable processes, and the ability to scale fast.
然而,除了学术和研究之外,数据科学不仅仅关于深度学习和NLP等主题。
数据科学家的很多商业价值来自提供由大量数据带来的清晰度和见解。这个角色可以包含从数据工程到数据分析和报告的所有内容-可能为了好的测量结果投入了机器学习。
在创业公司尤其如此。早期和中期企业的数据需求通常脱离神经网络和和计算机视觉领域。(当然,除非这些是其产品/服务的核心功能)。
相反,他们需要准确的分析,可靠的流程和快速扩展的能力。
Therefore, the skills required for many advertised data science roles are broad and varied. Like any pursuit in life, much of the value comes from mastering the basics. The fabled 80:20 rule applies — approximately 80% of the value comes from 20% of the skillset.
Here’s an overview of some of the fundamental skills that any aspiring data scientist should master.
Start with statistics
The main attribute a data scientist brings to their company is the ability to distill insight from complexity. Key to achieving this is understanding how to uncover meaning from noisy data.
因此,许多广告数据科学家所需的技能是广泛和多样的。就像生活中的任何追求一样,大部分的价值来自于掌握基础知识。传说中的80:20原则适用于,几乎80%的价值来自于技能组的20%。
以下是任何有抱负的数据科学家都应该掌握的基础技能的一项概览。
从统计开始
数据科学家为其公司带来的主要贡献是能够从复杂性中提取洞察力。 实现这一目标的关键是了解如何从杂乱无章的数据中揭示意义。
Statistical analysis is therefore an important skill to master. Stats lets you:
-
Describe data, to provide a detailed picture to stakeholders
-
Compare data and test hypotheses, to inform business decisions
-
Identify trends and relationships that provide real predictive value
Statistics provides a powerful set of tools for making sense of commercial and operational data.
But be wary! The one thing worse than limited insights are misleading insights. This is why it is vital to understand the fundamentals of statistical analysis.
Fortunately, there are a few guiding principles you can follow.
因此统计分析是一项非常重要的需要掌握的技能。可以帮你实现:
· 描述数据,向利益相关者提供详细的画面
· 比较数据和测试假设,以便为业务决策提供信息
· 确定提供真实预测价值的趋势和关系
统计数据提供了一套强大的工具,用于理解商业和运营数据。
但是请当心!比有限见解更糟糕的一件事是误导性的见解。 这就是理解统计分析基础的重要原因。
幸运的是,你可以遵循一些指导原则。
Assess your assumptions
It’s very important to be aware of assumptions you make about your data.
Always be critical of provenance, and skeptical of results. Could there be an ‘uninteresting’ explanation for any observed trends in your data? How valid is your chosen stats test or methodology? Does your data meet all the underlying assumptions?
Knowing which findings are ‘interesting’ and worth reporting also depends upon your assumptions. An elementary case in point is judging whether it is more appropriate to report the mean or the median of a data set.
Often more important than knowing which approach to take, is knowing which not to. There are usually several ways to analyze a given set of data, but make sure to avoid common pitfalls.
For instance, multiple comparisons should always be corrected for. Under no circumstances should you seek to confirm a hypothesis using the same data used to generate it! You’d be surprised how easily this is done.
评估你的假设
了解你对数据所做的假设是非常重要的。
始终对证据保有批判性,并对结果持怀疑态度。对于数据中观察到的任何趋势,是否存在“无趣”的解释?你选择的统计测试或方法是否有效?你的数据是否符合所有基本假设?
了解哪些发现是“有趣的”且值得报告也取决于你的假设。 一个基本的例子是判断报告数据集的均值或中值是否更合适。
通常比知道采取哪种方法更重要的是知道不采取哪种方法。 通常有几种方法可以分析给定的数据集,但要确保避免常见的陷阱。
例如,应始终纠正多重比较。 在任何情况下,你都不应该使用用于生成它的相同数据来确认假设! 你会惊讶地发现这很容易。
Distribution > Location
Whenever I talk about introductory statistics, I always make sure to emphasize a particular point: the distribution of a variable is usually at leastas interesting/informative as its location. In fact, it is often more so.
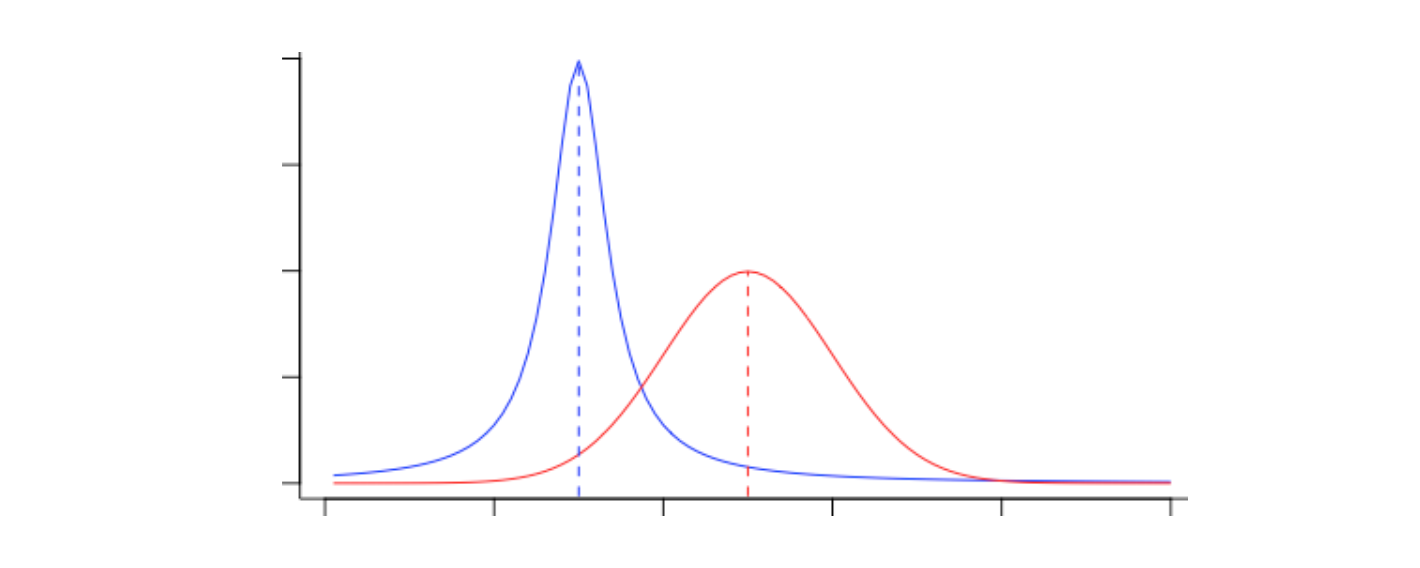
Central tendency is useful to know, but the distribution is often more interesting to understand!
分布 > 位置
每当我谈论介绍性统计时,我总要确保强调特定的一点:变量的分布通常至少是有趣/有信息量的位置。事实上,它往往更是如此。
中心倾向是有用的知识,但分布通常理解起来更有趣!
This is because the distribution of a variable usually contains information about the underlying generative (or sampling) processes.
For example, count data often follows a Poisson distribution, whereas a system exhibiting positive feedback (“reinforcement”) will tend to surface a power law distribution. Never rely on data being normally distributed without first checking carefully.
Secondly, understanding the distribution of the data is essential for knowing how to work with it! Many statistical tests and methods rely upon assumptions about how your data are distributed.
As a contrived example, always be sure to treat unimodal and bimodal data differently. They may have the same mean, but you’d lose a whole ton of important information if you disregard their distributions.
For a more interesting example that illustrates why you should always check your data before reporting summary statistics, take a look at Anscombe’s quartet:
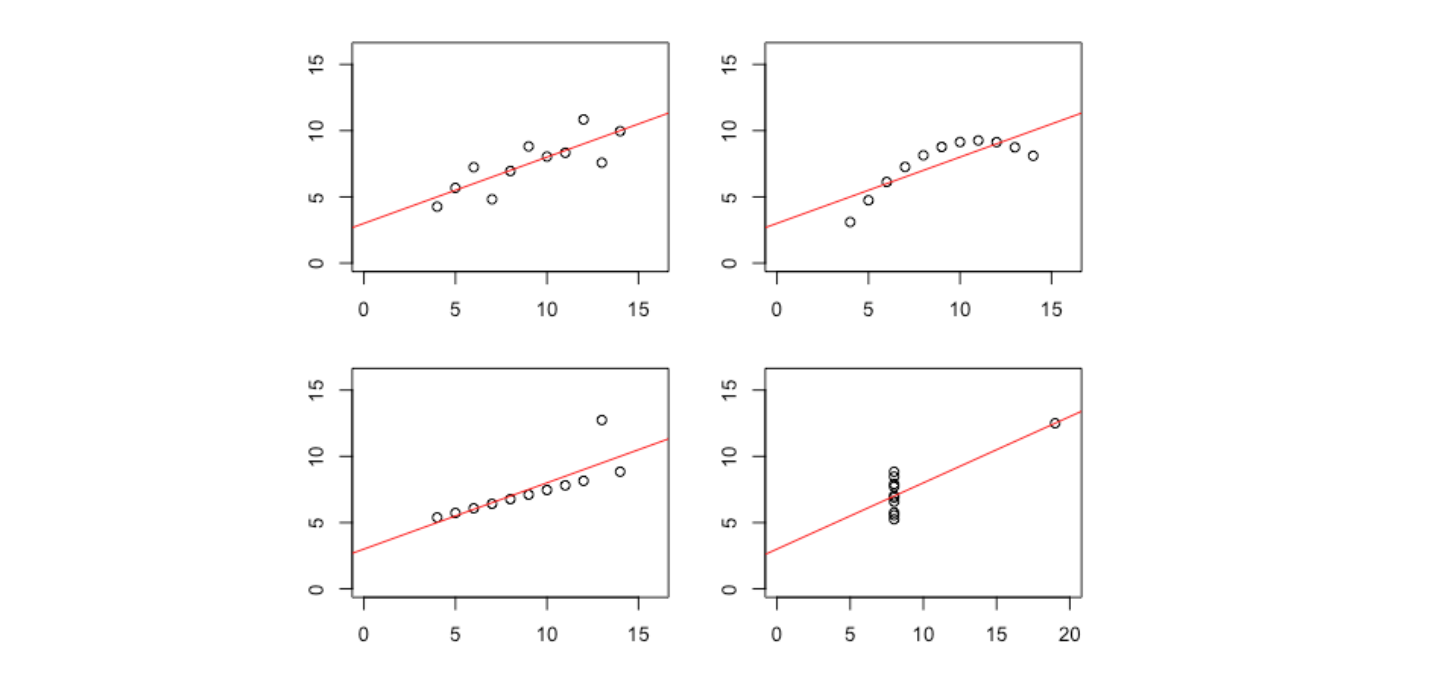
Different data; but nearly identical means, variances and correlations
这是因为变量的分布通常包含有关潜在生成(或采样)过程的信息。
例如,计数数据通常遵循泊松分布,而表现出正反馈(“强化”)的系统将倾向于表现出幂律分布。如果没有仔细检查,切勿依赖正常分发的数据。
其次,了解数据的分布对于了解如何使用它至关重要!许多统计测试和方法都依赖于有关数据分布方式的假设。
作为一个人为的例子,始终要确保以不同方式处理单峰和双峰数据。 它们可能具有相同的平均值,但如果忽略它们的分布,则会丢失大量重要信息。
一个更有趣的例子说明了为什么你应该始终在报告摘要统计信息之前检查数据,请查看Anscombe的四重奏:
不同的数据; 但几乎相同的手段,差异和相关性。
Each graph looks very distinctive, right? Yet each has identical summary statistics — including their means, variance and correlation coefficients. Plotting some of the distributions reveals them to be rather different.
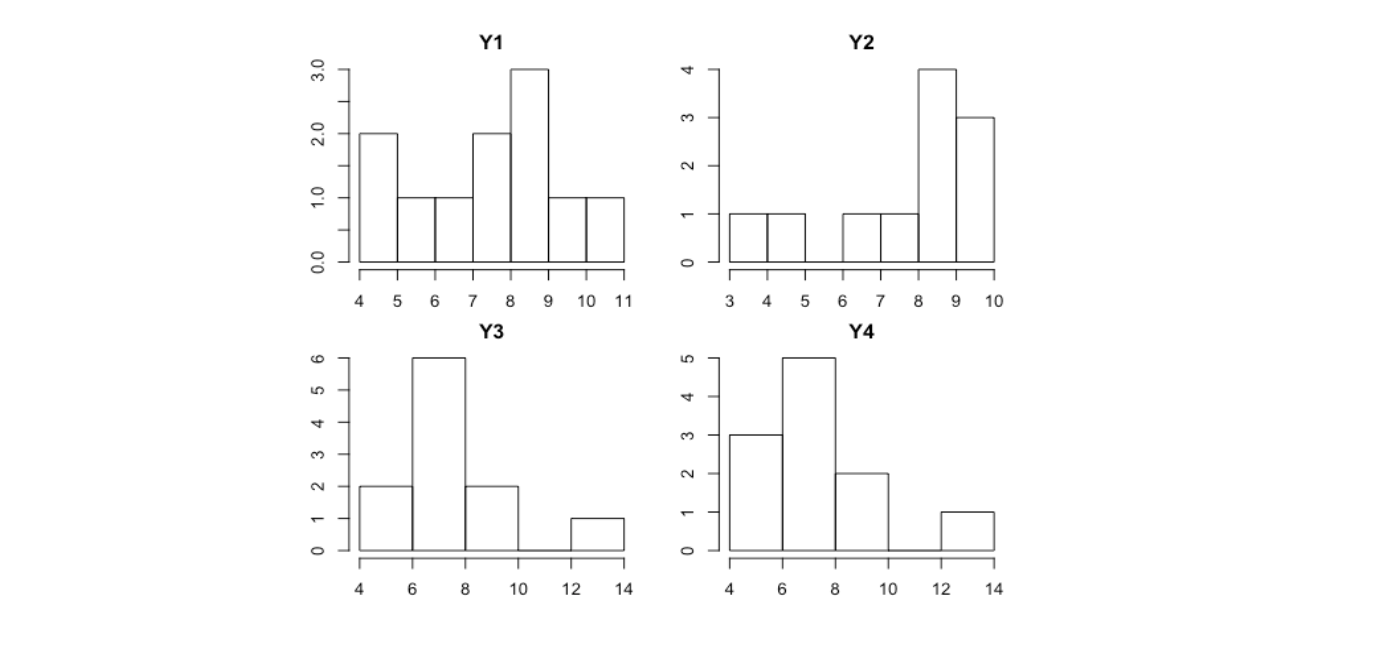
Finally, the distribution of a variable determines the certainty you have about its true value. A ‘narrow’ distribution allows higher certainty, whereas a ‘wide’ distribution allows for less.
每张图看起来都并不相同,对吧? 然而,它们很多汇总统计数据都是一致的——包括它们的均值,方差和相关系数。 我们需要绘制一些分布图来表明它们是极为不同的。
最后,变量的分布反映了它的真实值的确定性。 “集中”分布表明更高的确定性,而“分散”分布与此相反。
The variance about a mean is crucial to provide context. All too often, means with very wide confidence intervals are reported alongside means with very narrow confidence intervals. This can be misleading.
Suitable sampling
The reality is that sampling can be a pain point for commercially oriented data scientists, especially for those with a background in research or engineering.
In a research setting, you can fine-tune precisely designed experiments with many different factors and levels and control treatments. However, ‘live’ commercial conditions are often suboptimal from a data collection perspective. Every decision must be carefully weighed up against the risk of interrupting ‘business-as-usual’.
This requires data scientists to be inventive, yet realistic, with their approach to problem-solving.
平均值的方差对提供上下文至关重要。通常来讲,宽的置信区间的均值与窄的置信区间的均值一起被报告。 这可能会产生误导。
合理的采样
现实情况是,对于面向商业的数据科学家来说,尤其是对于那些从事研究或工程领域的人,抽样可能是一个难点。
在研究环境里,你可以精准地微调受很多因素影响的实验设计并“对症下药”。 但是,从数据收集的角度来看,“实时”商业条件往往不是最理想的。 每项决定都必须仔细权衡,以免造成打破“一如平常”情形的风险。
A/B testing is a canonical example of an approach that illustrates how products and platforms can be optimized at a granular level without causing major disturbance to business-as-usual.
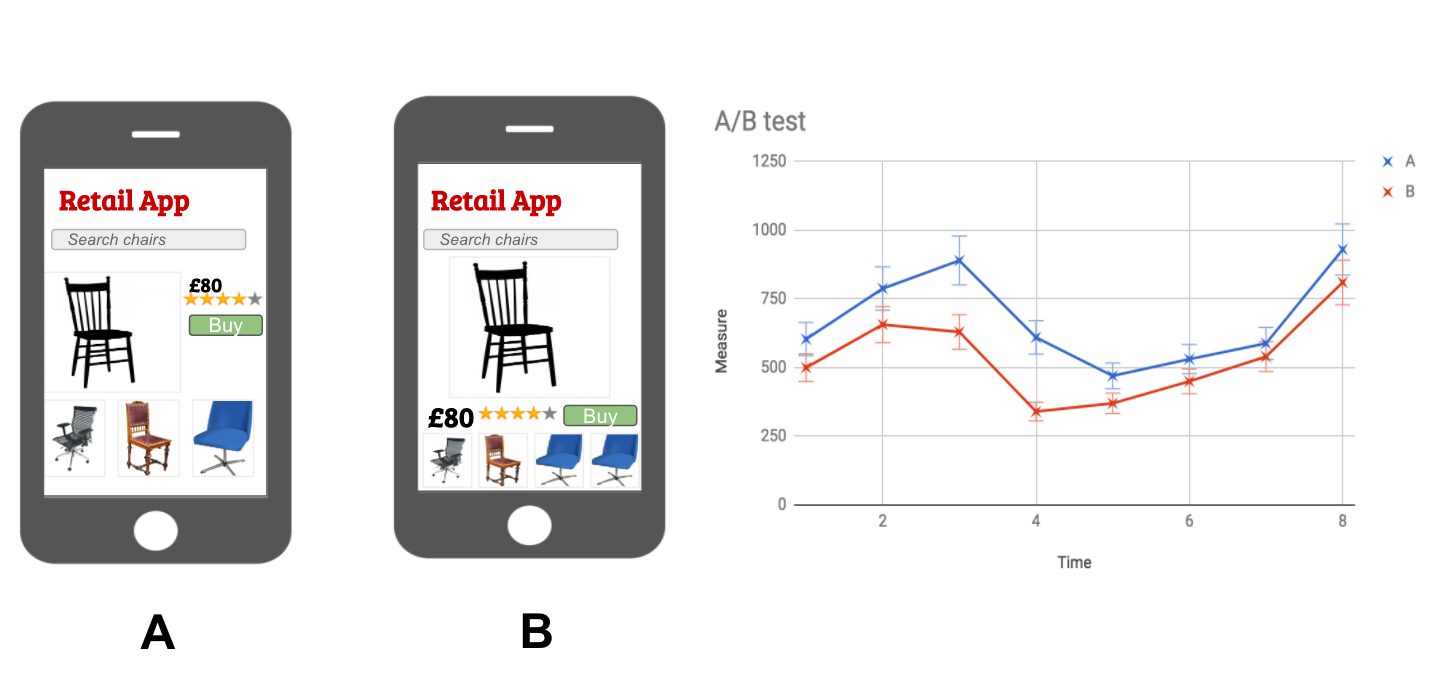
A/B testing is an industry standard for comparing different versions of products, in order to optimize them
A / B测试是一种典型实例,它表明了如何在粒度级别优化产品和平台,同时不会干扰“一如平常”的情形。
A/B测试是一种评估产品若干版本的测试方法,以便对产品各版本进行优化。
Bayesian methods may be useful for working with smaller data sets, if you have a reasonably informative set of priors to work from.
With any data you do collect, be sure to recognize its limitations.
Survey data is prone to sampling bias (often it is respondents with the strongest opinions who take the time to complete the survey). Time series and spatial data can be affected by autocorrelation. And last but not least, always watch out for multicollinearity when analyzing data from related sources.
Data Engineering
It’s something of a data science cliché, but the reality is that much of the data workflow is spent sourcing, cleaning and storing the raw data required for the more insightful upstream analysis.
Comparatively little time is actually spent implementing algorithms from scratch. Indeed, most statistical tools come with their inner workings wrapped up in neat R packages and Python modules.
如果你有一组合理的先验信息可供使用,贝叶斯方法对于处理较小的数据集非常有效。
对于你收集的数据,请务必认识到其局限性。
调查数据容易出现抽样偏差(会花时间完成调查的受访者通常具有鲜明的观点)。时间序列和空间数据会受到自相关性的影响。最后但并非不重要的是, 在分析来自相关来源的数据时, 一定要注意多重共线性。
数据工程
这是数据科学的一种陈词滥调,但实际情况是,大部分数据工作流程都花费在采购,清理和存储上游分析所需的原始数据上。
相较而言,用在从头开始执行算法的时间较少。 实际上,大多数统计工具都包含在R包和Python模块中。
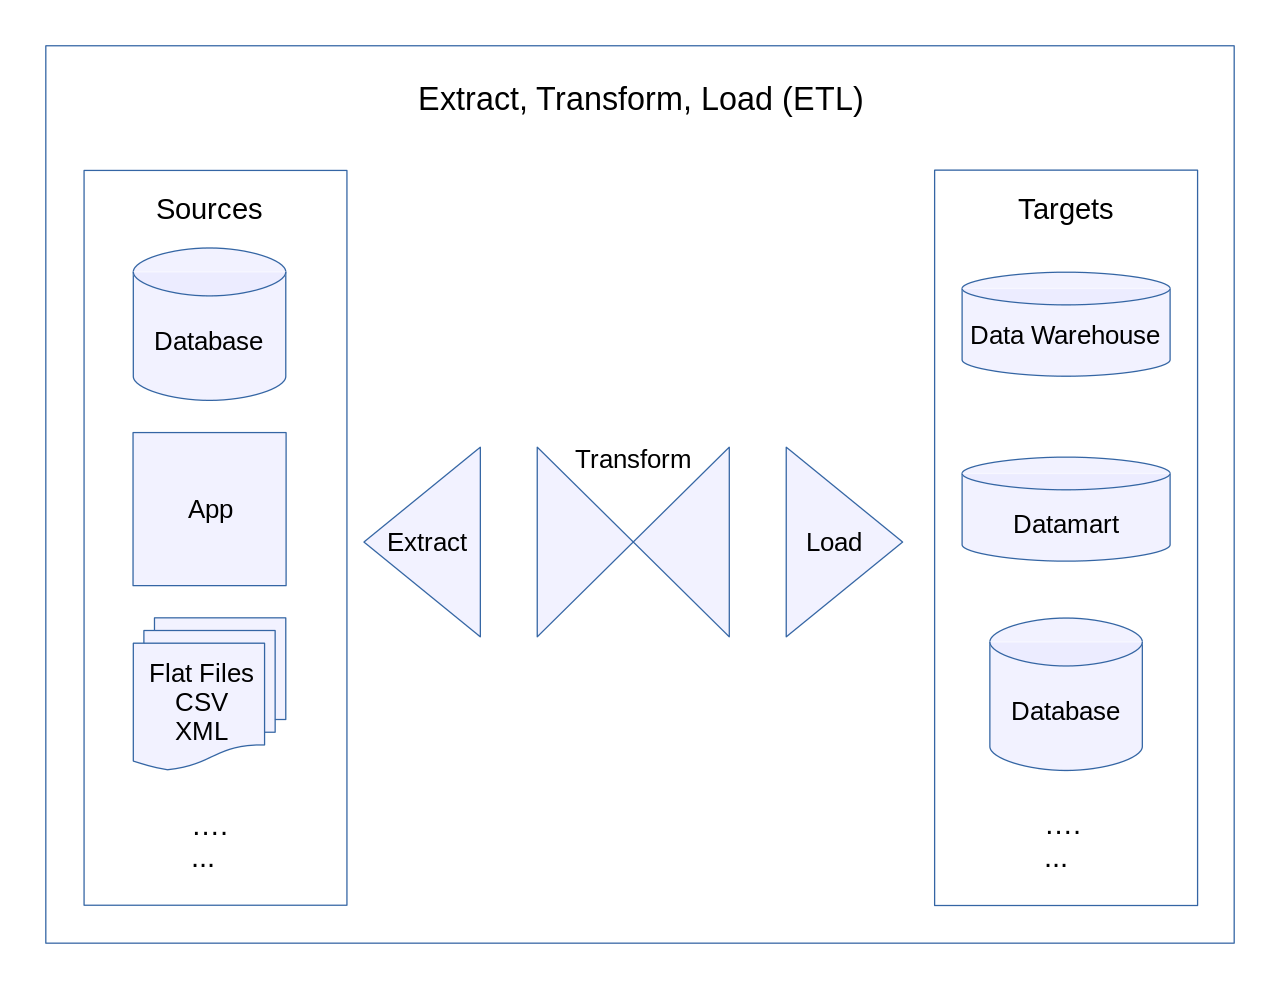
The ‘extract-transform-load’ (ETL) process is critical to the success of any data science team. Larger organizations will have dedicated data engineers to meet their complex data infrastructure requirements, but younger companies will often depend upon their data scientists to possess strong, all-round data engineering skills of their own.
Programming in practice
Data science is highly inter-disciplinary. As well as advanced analytical skills and domain-specific knowledge, the role also necessitates solid programming skills.
“提取 – 转换 – 加载”(ETL)过程对任何数据科学团队的成功都至关重要。大型企业都拥有专门的数据工程师来满足其复杂的数据基础架构要求,, 但小型公司往往要求他们的数据科学家拥有强大的、全面的数据工程技能。
实践编程
数据科学具有高度跨学科的特性。它不仅需要良好的分析能力和领域专业知识,还需要扎实的编程能力。
There is no perfect answer to which programming languages an aspiring data scientist should learn to use. That said, at least one of Python and/or R will serve you very well.

Either (or both) of these languages make a great starting point if you want to work with data
Whichever language you opt for, aim to become familiar with all its features and the surrounding ecosystem. Browse the various packages and modules available to you, and set up your perfect IDE. Learn the APIs you’ll need to use for accessing your company’s core platforms and services.
Databases are an integral piece in the jigsaw of any data workflow. Be sure to master some dialect of SQL. The exact choice isn’t too important, because switching between them is a manageable process when necessary.
对于有抱负的数据科学家应该学习使用的编程语言,没有标准的答案。 即便如此,Python和R语言都是很好地(数据分析)语言工具。
如果您想处理数据,这些语言中的任何一个(或两个)都是很好的选择。
无论您选择哪种语言,都希望熟悉其所有的语言特征和其周边的工具插件。 浏览可用的各种软件包和模块,并设置IDE。熟悉用于访问公司核心平台和服务所需的API。
数据库是任何数据工作流程拼图中不可或缺的一部分。 一定要掌握一些SQL的语法。 确切的选择并不太重要,因为在必要时,它们之间的切换是一个可管理的过程。
NoSQL databases (such as MongoDB) may also be worth learning about, if your company uses them.
Becoming a confident command line user will go a long way to boosting your day-to-day productivity. Even passing familiarity with simple bash scripting will get you off to a strong start when it comes to automating repetitive tasks.
Effective coding
A very important skill for aspiring data scientists to master is coding effectively. Reusability is key. It is worth taking the time (when it is available) to write code at a level of abstraction that enables it to be used more than once.
However, there is a balance to be struck between short and long-term priorities.
如果你的公司使用NoSQL数据库(例如MongoDB),它们也很值得学习。
成为一名自信的命令行用户将大大提高您的日常工作效率。 即使仅熟悉简单的bash脚本,也会让你在自动执行重复性任务时有一个好的效率。
高效编程
有抱负的数据科学家掌握的一项非常重要的技能是有效编码。 可重用性是关键。 应该花时间(当它可用时)在抽象级别编写代码,使其能够被多次使用。
当然,要保持长期需要和近期亟需之间的平衡。
There’s no point taking twice as long to write an ad hoc script to be reusable if there’s no chance it’ll ever be relevant again. Yet every minute spent refactoring old code to be rerun is a minute that could have been saved previously.
Software engineering best practices are worth developing in order to write truly performant production code.
Version management tools such as Git make deploying and maintaining code much more streamlined. Task schedulers allow you to automate routine processes. Regular code reviews and agreed documentation standards will make life much easier for your team’s future selves.
In any line of tech specialization, there’s usually no need to reinvent the wheel. Data engineering is no exception. Frameworks such as Airflow make scheduling and monitoring ETL processes easier and more robust. For distributed data storage and processing, there are Apache Spark and Hadoop.

It isn’t essential for a beginner to learn these in great depth. Yet, having an awareness of the surrounding ecosystem and available tools is always an advantage.
如果没有任何它再次被使用的机会,那么是没有必要花费两倍的时间编写一个可重用临时脚本的。 然而,重新运行重构旧代码所花费的每一分钟都是以前可以保存的一分钟。
为了编写真正高效的产品代码,软件工程最佳实践是开发。
版本管理工具 (如 Git) 使部署和维护代码更加精简。任务计划程序允许您自动化常规进程。定期的代码审查和商定的文档标准将使您的团队的未来编程更加轻松。
在任何技术专业化的行业中, 通常都没有必要重新发明轮子。数据工程也不例外。诸如Airflow等框架使调度和监视 ETL 过程更容易、更健壮。对于分布式数据存储和处理, 有 Apache Spark和 Hadoop。
对于初学者来说,深入学习这些并不是必需的。 但是,了解模块插件和可用工具始终是一个优势。
Communicate clearly
Data science is a full stack discipline, with an important stakeholder-facing front end: the reporting layer.
The fact of the matter is simple — effective communication brings with it significant commercial value. With data science, there are four aspects to effective reporting.
-
Accuracy
This is crucial, for obvious reasons. The skill here is knowing how to interpret your results, while being clear about any limitations or caveats that may apply. It’s important not to over or understate the relevance of any particular result. -
Precision
This matters, because any ambiguity in your report could lead to misinterpretation of the findings. This may have negative consequences further down the line. -
Concise
Keep your report as short as possible, but no shorter. A good format might provide some context for the main question, include a brief description of the data available, and give an overview of the ‘headline’ results and graphics. Extra detail can (and should) be included in an appendix. -
Accessible
There’s a constant need to balance the technical accuracy of a report with the reality that most of its readers will be experts in their own respective fields, and not necessarily data science. There’s no easy, one-size-fits-all answer here. Frequent communication and feedback will help establish an appropriate equilibrium.
The Graphics Game
超级沟通力
数据科学是一个完整的栈学科,面向重要利益相关前端:报告层。
这件事的事实是清晰的——有效的沟通带来了重要的商业价值。在数据科学方面, 高效的报告分为以下四个方面:
●准确性
这显然是至关重要的。 这里的技能是知道如何解释你的结果,同时明确可能适用的任何限制或警告。 重要的是不要过度或低估任何特定结果的相关性。
●精确性
这很重要, 因为你报告中的任何歧义都可能导致对调查结果的误解。这可能会导致进一步的负面后果。
●简洁性
尽量保持你的报告简短, 但也不要短的过分。良好的格式可能会为主要问题提供一些整体概况, 包括对可用数据的简要描述, 并概述 “标题” 结果和图形。额外的细节可以 (也应该) 包含在附录中。
●易得性
经常需要平衡报告的技术准确性和现实, 即大多数读者将是各自领域的专家, 而不一定是数据科学。这里没有简单的, 全尺寸的答案。频繁的沟通和反馈将有助于建立一个适当的平衡。
Powerful data visualizations will help you communicate complex results to stakeholders effectively. A well-designed graph or chart can reveal in a glance what several paragraphs of text would be required to explain.
There’s a wide range of free and paid-for visualization and dashboard building tools out there, including Plotly, Tableau, Chartio, d3.js and many others.
For quick mock-ups, sometimes you can’t beat good ol’ fashioned spreadsheet software such as Excel or Google Sheets. These will do the job as required, although lack the functionality of purpose-built visualization software.
图形游戏
强大的数据可视化将帮助您有效地向利益相关者传达复杂的结果。 精心设计的图形或图表可以一目了然地显示需要解释的几段文本。
有一个广泛的免费和付费的可视化和仪表板搭建工具, 包括 Plotly, Tableau, Chartio, d3. js 和许多其他工具。
对于快速模拟, 有时你无法击败优秀的老式电子表格软件, 如 Excel 或Google Sheets。尽管缺少专门构建的可视化软件的功能,但他们将按照要求完成工作。
When building dashboards and graphics, there are a number of guiding principles to consider. The underlying challenge is to maximize the information value of the visualization, without sacrificing ‘readability’.

How not to present data — in general, keep it simple (for more on this example, read this cool blog post)
在构建仪表板和图形时,有许多指导原则可以借鉴。 潜在的挑战是最大化可视化的信息价值,而不牺牲“可读性”。
如何不呈现数据—— 通常来讲,保持简单(更多实例,请移步这篇博客)。
An effective visualization reveals a high-level overview at a quick glance. More complex graphics may take a little longer for the viewer to digest, and should accordingly offer much greater information content.
If you only ever read one book about data visualization, then Edward Tufte’s classic The Visual Display of Quantitative Information is the outstanding choice.
Tufte single-handedly popularized and invented much of the field of data visualization. Widely used terms such as ‘chartjunk’ and ‘data density’ owe their origins to Tufte’s work. His concept of the ‘data-ink ratio’ remains influential over thirty years on.
The use of color, layout and interactivity will often make the difference between a good visualization and a high-quality, professional one.

Data visualization done better [Source]
Ultimately, creating a great data visualization touches upon skills more often associated with UX and graphic design than data science. Reading around these subjects in your free time is a great way to develop an awareness for what works and what doesn’t.
Be sure to check out sites such as bl.ocks.org for inspiration!
高效的可视化可快速浏览高级概述。更复杂的图形可能需要更长时间才能使观看者理解,因此应该提供更多的信息内容。
如果你只读一本关于数据可视化的书,那么Edward Tufte的经典《The Visual Display of Quantitative Information》就是你的最佳选择。
Tufte一手发明和推广了数据可视化领域的大半江山。 广泛使用的术语如“chartjunk”和“data density”就源于Tufte的作品。 三十多年来,他的“data-ink ratio”概念仍然具有影响力。
颜色,布局和交互性的使用通常会在良好的可视化和高质量的专业可视化之间产生差异。
数据可视化做得更好
最终,创建一个出色的数据可视化技术会涉及与UX和图形设计相关的技能,而不是数据科学。 在空闲时间阅读这些科目是一种很好的方式来培养对什么有效和什么无效的意识。
请务必查看bl.ocks.org等网站以获取灵感!
Data science requires a diverse skillset
There are four core skill areas in which you, as an aspiring data scientist, should focus on developing. They are:
-
Statistics, including both the underlying theory and real world application.
-
Programming, in at least one of Python or R, as well as SQL and using the command line
-
Data engineering best practices
-
Communicating your work effectively
数据科学要求多样化的技能
作为一名有抱负的数据科学家,有四个核心技能应该着重培养。它们分别是:
● 统计,包括基础理论和现实世界的应用;
● 编程,至少会Python或R中的一个,以及SQL和使用命令行;
● 数据工程最佳实践;
● 良好的沟通能力。
Bonus! Learn constantly
If you have read this far and feel at all discouraged — rest assured. The main skill in such a fast-moving field is learning how to learn and relearn. No doubt new frameworks, tools and methods will emerge in coming years.
The exact skillset you learn now may need to be entirely updated within five to ten years. Expect this. By doing so, and being prepared, you can stay ahead of the game through continuous relearning.
You can never know everything, and the truth is — no one ever does. But, if you master the fundamentals, you’ll be in a position to pick up anything else on a need-to-know basis.
And that is arguably the key to success in any fast developing discipline.
奖金!学不止步
如果你已经阅读了这一点,并感到沮丧——请放心。 这个快速发展的领域的主要技能是学习如何学习和重新学习。毫无疑问,未来几年将出现新的框架,工具和方法。
你现在学到的技能可能在五到十年内需要完全更新。可以期待的是,这是一个你通过不断学习就能保持领先的游戏。
你永远不能知道所有的一切,事实是 – 没有人做到过。 但是,如果你掌握了基础知识,你就可以在需要知道的基础上获得其他任何东西。
这无疑是在任何快速发展的学科中取得成功的关键。





暂无评论内容